

Annual report of the disabled people in Thailand

Situation of people with disabilities in Thailand
- - 2,138,155 people with disabilities who received a disability identification card (3.23 percent of the total population)
****Demographics of Thailand from Central Registration Office, Department of Provincial Administration as of December 31, 2021 - - Disabled people, 1,117,056 males (52.24%), and females 1,021,099 (47.76%)
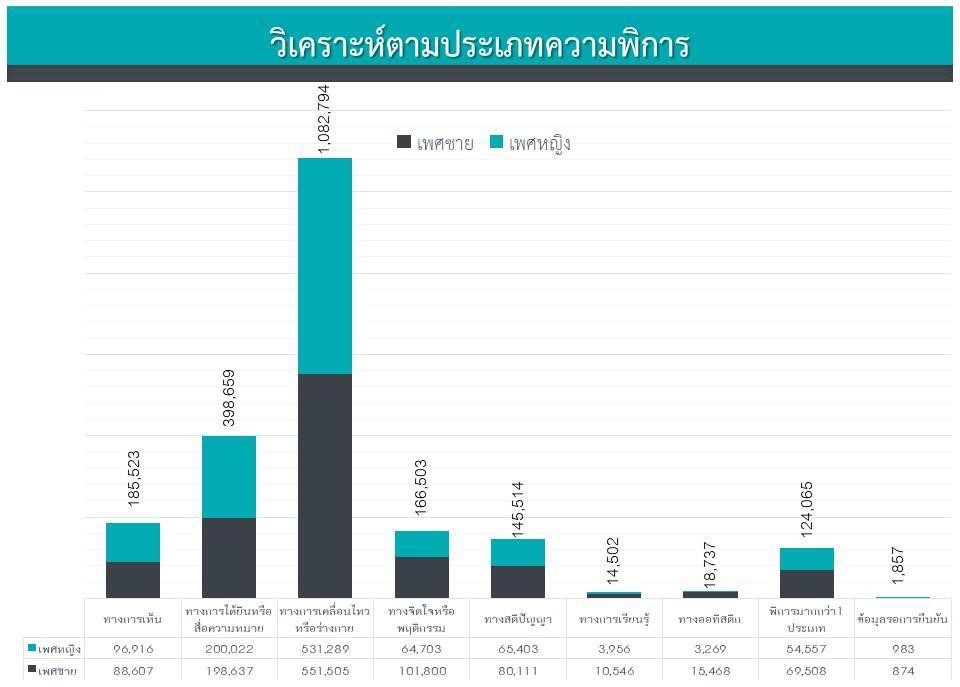
disability type
- 1st, kinetic or physical, 1,082,795 people (50.64%)
- 2nd place through hearing or communicating, 398,659 people (18.65 percent)
- 3rd place visually 185,523 people (8.68%)
- 4th place, mental or behavioral, 166,503 people (7.79%)
- 5th place intellectually, 145,514 people (6.81 percent)
- 6th place, 124,065 people with more than one type of disability (5.80 percent)
- 7th place with autism, 18,737 (0.88%)
- 8th place in learning, 14,502 people (0.68%)
- 9th place, data pending confirmation, 1,857 people (0.09 percent)
- Total 2,138,155 people (100.00 percent)
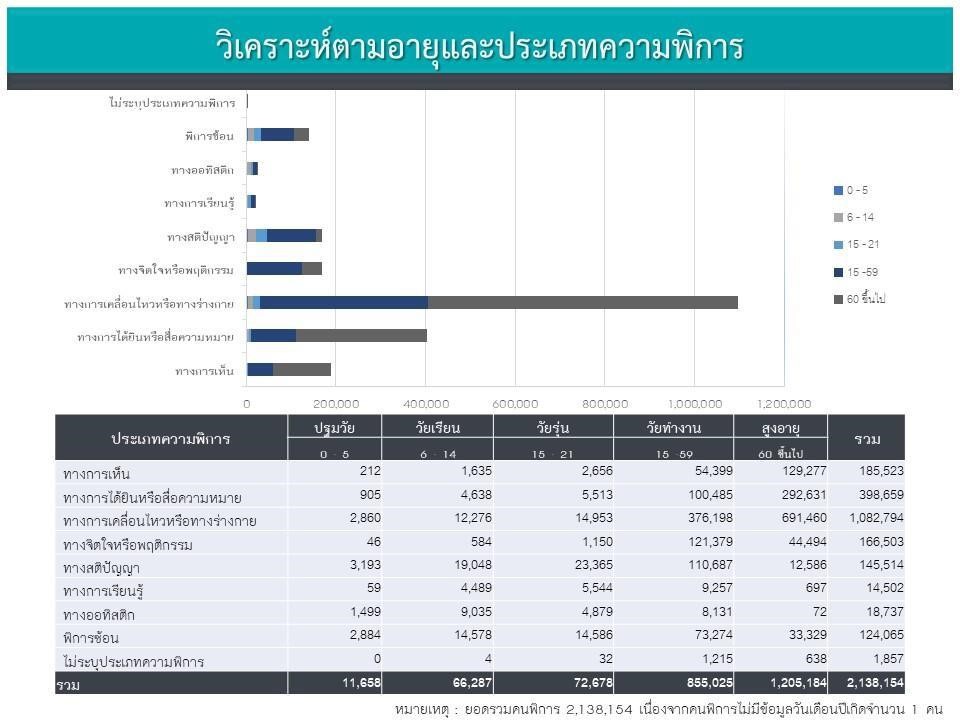
analyzed by age and disability type
- - There are 1,205,184 persons with disabilities aged 60 years and over, 56.37% (of the total number of persons with disabilities)
- - 855,025 people with disabilities in working age, aged 15 - 59, 39.99 per cent (of the total number of people with disabilities)
- - People with disabilities aged 15 - 59 years and elderly people (aged 60 years and over) had the greatest disability. accounted for 44.00 percent and 57.37% of the number of people with disabilities aged 15-59 and 60 years and over, respectively.
- - People with disabilities in childhood and school age (0 - 21 years) had the highest ratio of people with disabilities, 45,629, representing 30.28 percent of the number of people with disabilities in childhood and school age ( 0 - 21 years) all
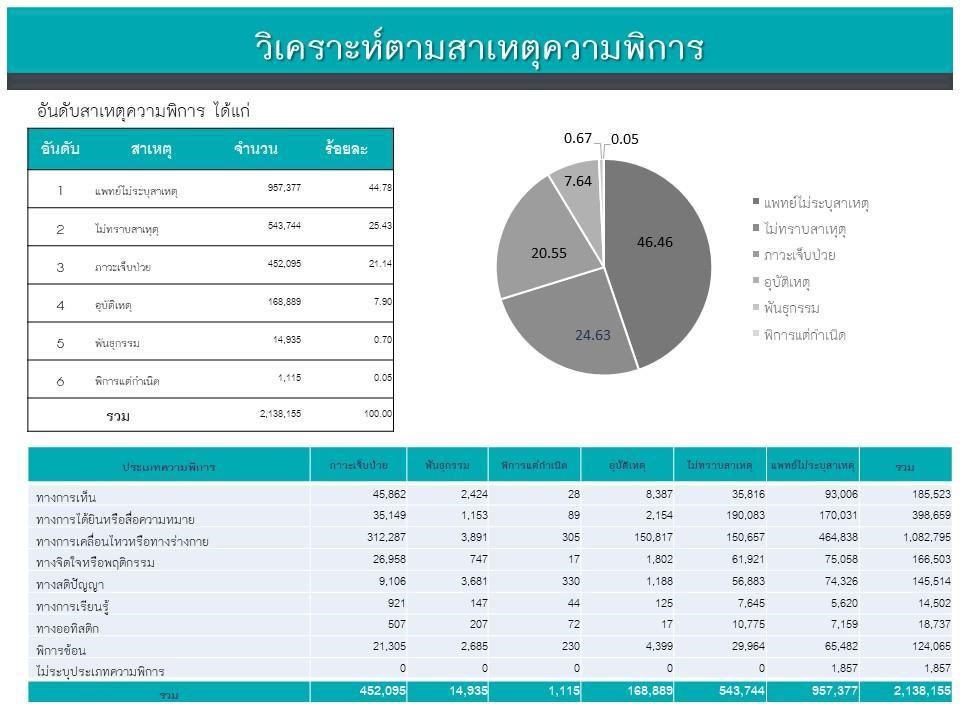
cause of disability
- 1st place: 44.78% of physicians did not specify cause of disability
- 2nd place, unknown reason 25.43
- 3rd place, other illnesses/diseases 21.14 percent
- 4th place, accident 7.90%
- 5th place, hereditary / heredity 0.70%, 6th place, 0.05 percent congenital
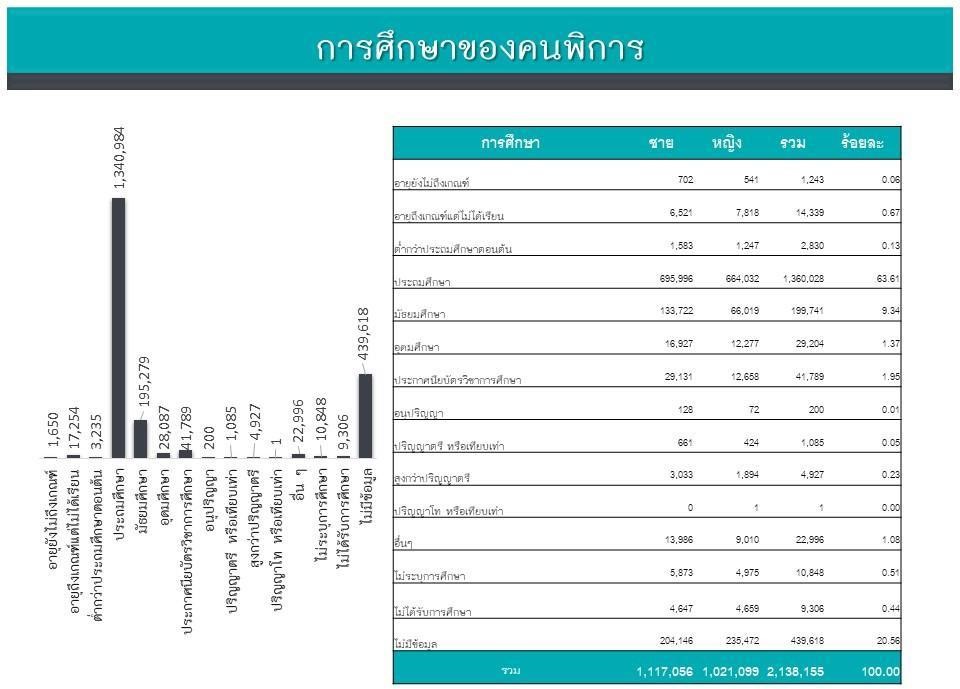
education of people with disabilities
- - 24,888 people with disabilities who did not receive education, or 1.16 percent (of people with disabilities with a disability identification card), divided into
- - Underage age 1,243 people (4.99% of people with disabilities who are not educated)
- - 14,339 persons with disabilities who reached the age of majority without education (57.61% of those with disabilities who did not receive education)
- - and 9,306 people with uneducated disabled people (38.39% of uneducated people with disabilities)
- - 1,673,649 people with disabilities who received education, or 78.28 percent (of people with disabilities with a disability identification card)
- 1st place, primary education level, 1,360,028 people (81.26 percent)
- 2nd place, education level, secondary school, 199,741 people (11.93%)
- 3rd place, education level Certificate in Education, 41,789 people (2.50 percent)
- 4th place, higher education level, 10,848 people (1.74 percent)
- 5th place, education level Unspecified study, 16,855 people (0.65%)
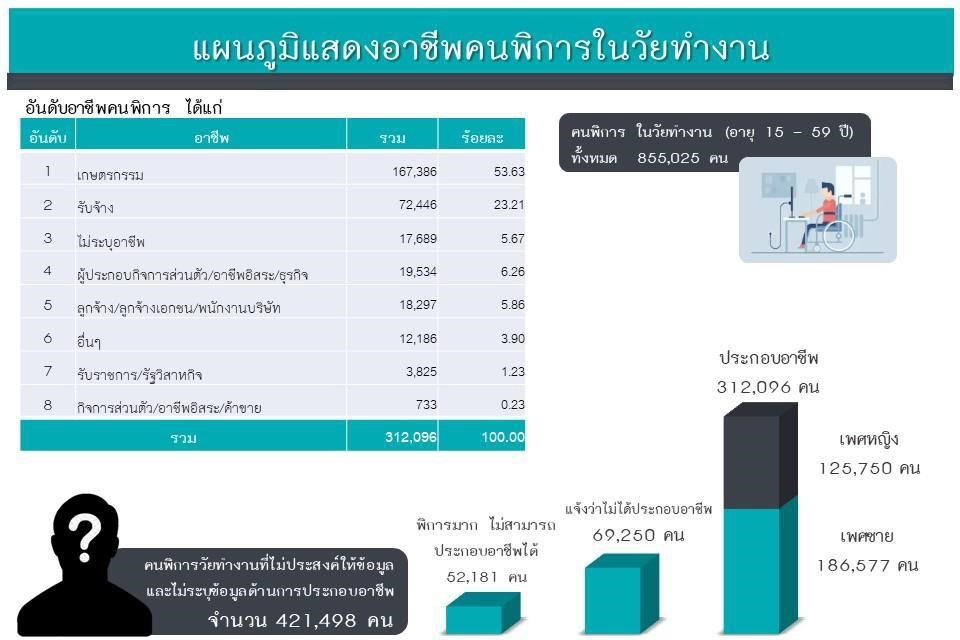
people with disabilities who are of working age
- 855,025 persons with disabilities who are of working age (15 - 59 years old)
- 1. 312,096 people with disabilities who are engaged in occupation, 36.50% (of the total number of people with disabilities of working age)
- 2. Persons with disabilities who are able to work but noted that 69,250 people were unemployed, 8.10% (of the total number of people with disabilities of working age)
- 3. Persons with disabilities who are unable to work (because of disabilities of 52,181 people, 6.10 percent (of the total number of people with disabilities of working age)
- 4. 421,498 persons with disabilities who do not wish to provide information and do not provide occupational information, 49.30% (of the total number of persons with disabilities of working age)
- 5. Occupation of persons with disabilities Agriculture 53.63% General employed 23.21% Unspecified 5.67% Self-employed/self-employed 6.26%
- Private sector employees/company employees 5.86%, others 3.90%, government service/state enterprises 1.23%, and personal business/self-employed/trading 0.23%
source:www.dep.go.th