
Annual report of the disabled people in Thailand
Situation of people with disabilities in Thailand
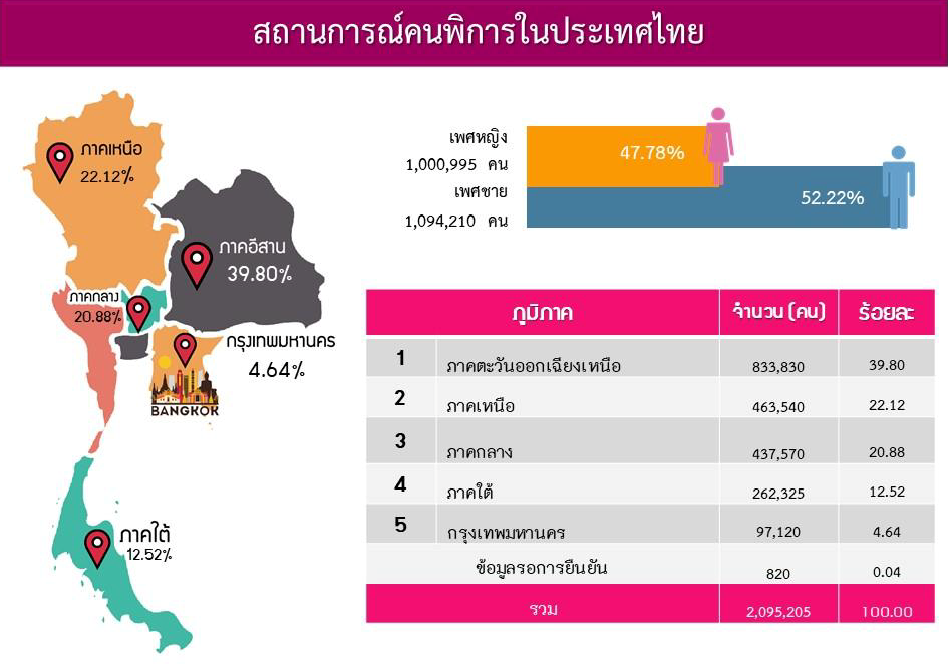
- - 2,095,205 people with disabilities who received a disability identification card (3.17 percent of the country's population)
- - Persons with disabilities: 1,094,210 (52.22%) males and 1,000,995 females (47.78%).
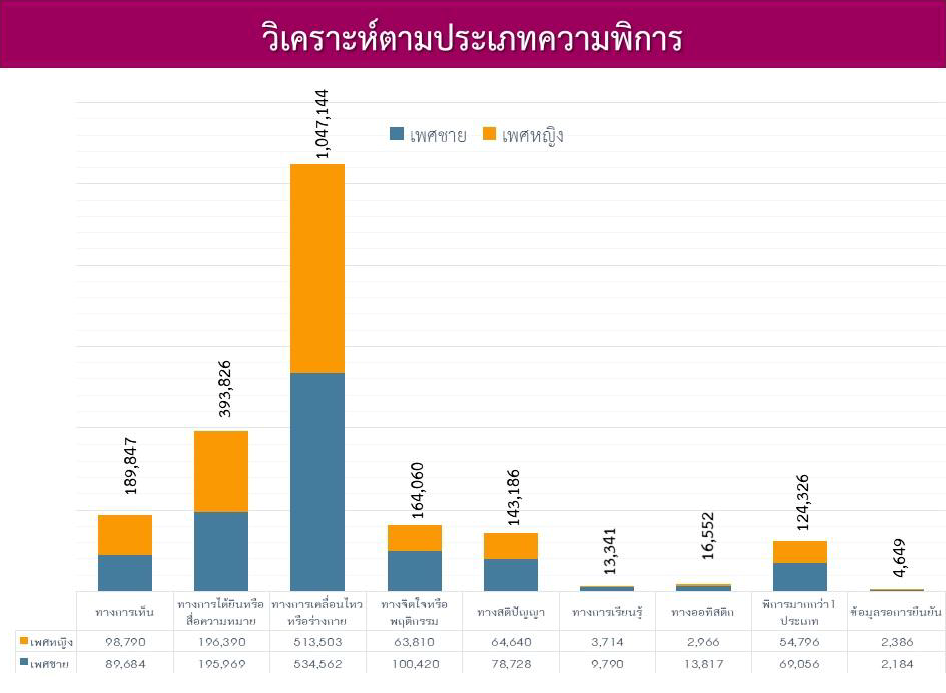
disability type
- 1. kinetic or physical, 1,048,065 people (50.02%)
- 2. hearing or communicating, 392,359 people (18.73%)
- 3. visually 188,474 people (9.00%)
- 4. mental or behavioral, 164,230 people (7.84%)
- 5. intellectually, 143,368 people (6.84%t)
- 6. 143,368 persons with more than one type of handicap (5.91%)
- 7. autism, 16,783 people (0.80%)
- 8. learning, 13,504 people (0.64%)
- 9. data pending confirmation, 4,570 people (0.2%)
- - Total 2,095,205 people (100.00%)
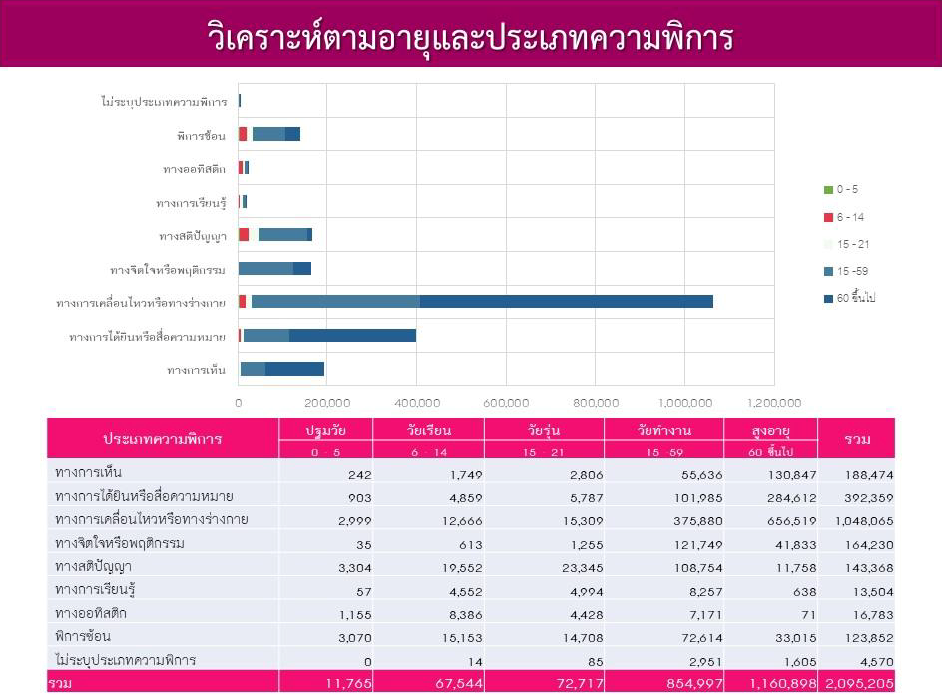
analyzed by age and disability type
- - Persons with disabilities aged 60 years and over are 1,160,898 people, 55.41 percent (of the total number of people with disabilities).
- - Persons with disabilities in working age, aged 15 - 59 years, amounted to 854,997 people, 40.81 percent (of the total number of people with disabilities).
- - People with disabilities aged 15 to 59 and elderly people (aged 60 and over) had the greatest disabilities with mobility or physical disabilities. accounted for 44.11% and 56.34% of the number of people with disabilities aged 15-59 years and 60 years and over, respectively.
- - People with disabilities who were in childhood and school age (0 - 21 years) had the highest ratio of people with disabilities at 46,201, accounting for 30.39 percent of the number of people with disabilities in childhood and school age (0 - 21 years). ) all
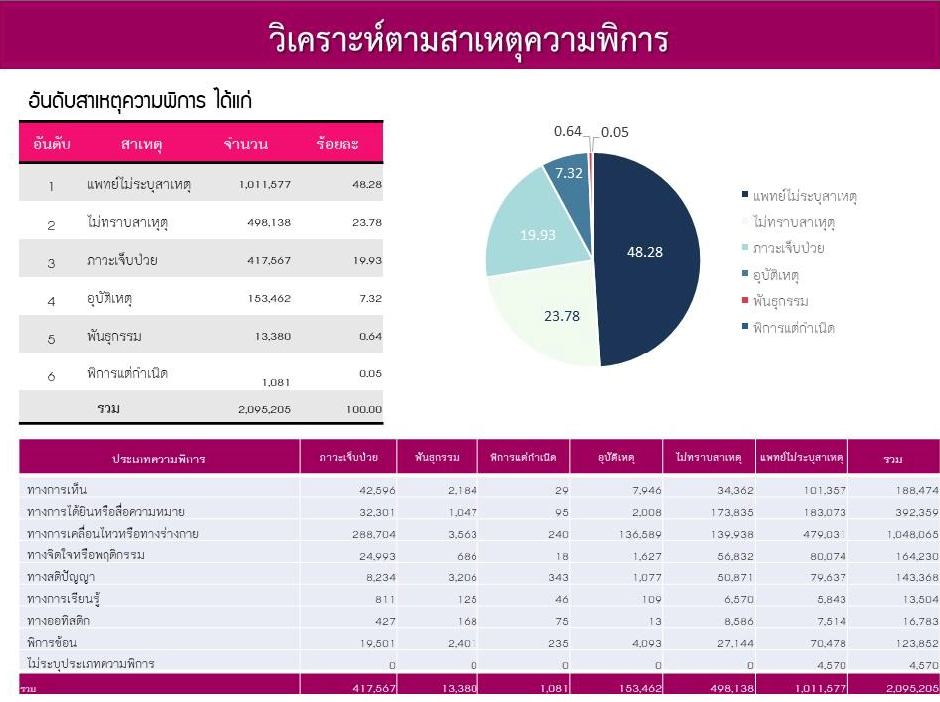
cause of disability
- 1. Doctors did not specify the cause of the disability, 48.28%
- 2. Cause unknown 23.78
- 3. Other illnesses/diseases 19.93%
- 4. Accident 7.32%
- 5. Hereditary/genetic 0.64%
- 6. Congenital disabilities 0.05%
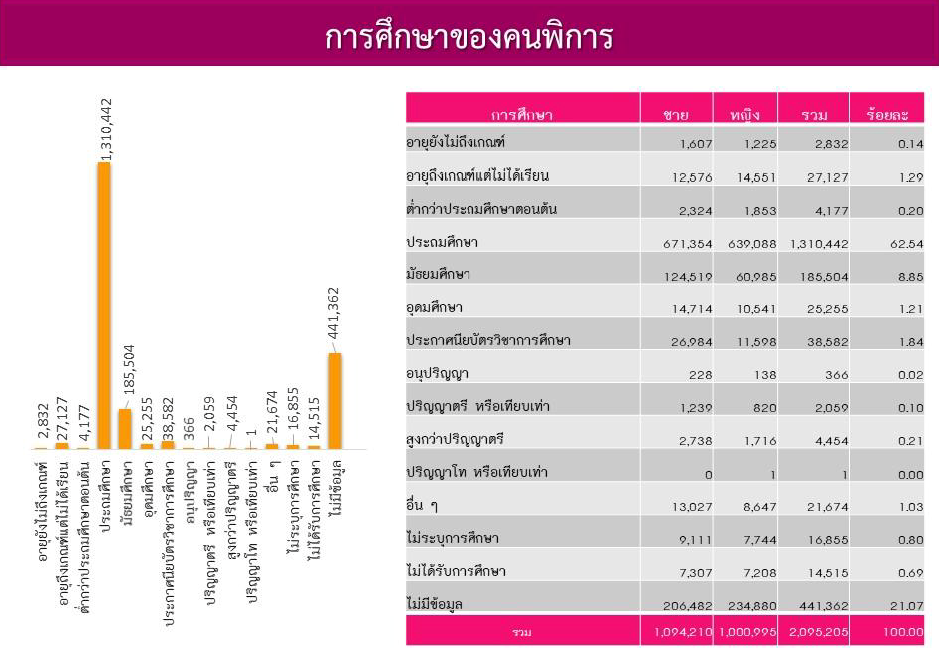
education of people with disabilities
- - 44,474 people with disabilities who were not educated, or 2.12 percent (of people with disabilities with a disability identification card), divided into:
- - Underage age 2,832 people (6.37 percent of people with disabilities not receiving education)
- - 27,127 persons with disabilities who reached the age of majority without education (61.00 per cent of persons with disabilities who did not receive education)
- - and 14,515 uneducated persons with disabilities (32.64% of uneducated persons with disabilities)
- - 1,609,369 people with disabilities who received education, representing 76.81 percent (of people with disabilities with a disability identification card)
- 1. Education level Primary school 1,310,442 people (81.43%)
- 2. Education level Secondary school 185,504 people (11.53%)
- 3. Education level Certificate in Education 38,582 people (2.40%)
- 4. Higher education level: 25,255 people (1.57%)
- 5. Education level Study not identified 16,855 people (1.05%)
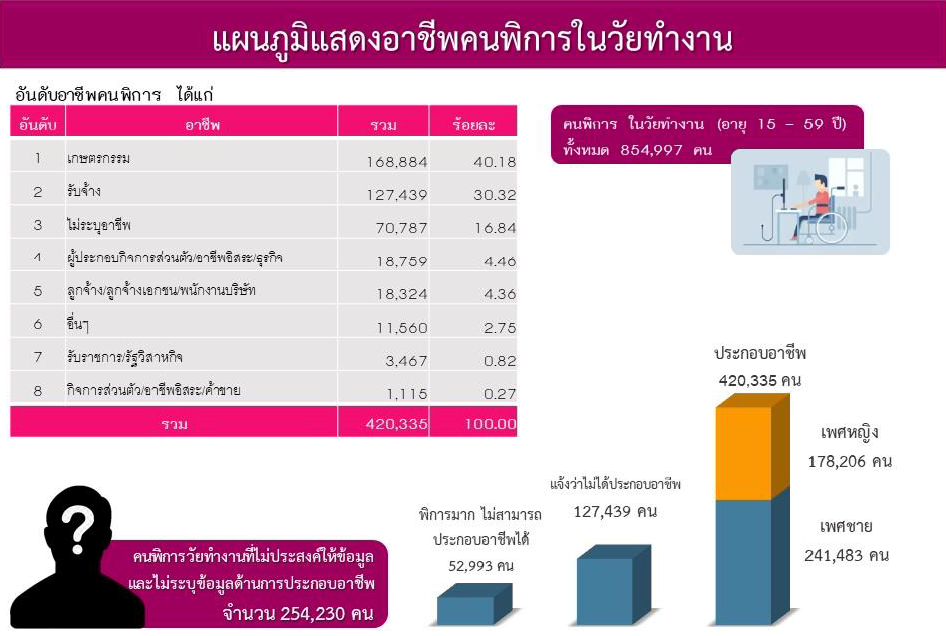
people with disabilities who are of working age
- Age 15 - 60 years old, 854,997 people
- 1. 420,335 people with disabilities who are engaged in occupation, 49.16% (of the total number of people with disabilities of working age)
- 2. Persons with disabilities who are able to work but reported that 127,439 people had no occupation, 14.91% (of the total number of people with disabilities of working age)
- 3. Persons with disabilities who are unable to work (due to disabilities, unable to help themselves) 52,993 people 6.20% (of the total number of people with disabilities of working age)
- 4. 254,230 persons with disabilities who do not wish to provide information and do not provide occupational information, 29.73% (of the total number of persons with disabilities of working age)
- 5. Occupation of persons with disabilities Agriculture 40.18% General employed 30.32% Unspecified 16.84 percent Self-employed/self-employed 4.46% Private sector/company employees 4.36% Other 2.75% government service /State enterprises 0.82% and personal business/freelance/trading 0.27%
source:www.dep.go.th